Get the most from your training reports
Running reports in TrainCaster is very easy, so you may wonder why a post about something so easy?
The answer is also easy: although it's simple enough to run any number of training reports, you may not be taking advantage of everything the reports tab has to offer.
For example, say you run the same training report each month. Did you know you can save the report setup to run again, automatically? Saves time and is easy to do.
So peruse the tips below to see if you are getting the most from your training reports.
Customize your report columns
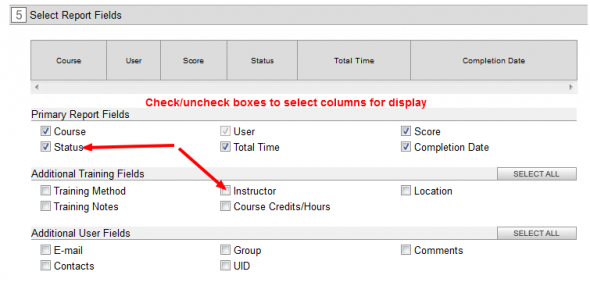
Every time you run a report you can select which columns you want displayed. This allows you to customize your report, including/excluding columns based on the information you need to see.
To select report columns, un/check the box next to the column name.

Automate your reports
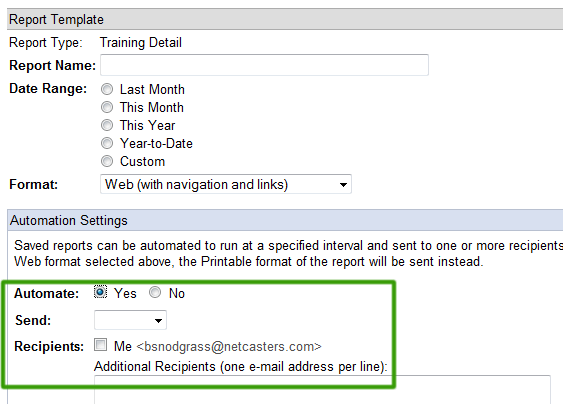
Did you know you can create a report, save the settings and schedule it to run automatically? This is a great feature that saves you time and streamlines your review process.
To automate reports:
- Click the Reports tab and select a report to run.
- Complete the setup form by selecting the information you want to see on the report. Click Run Report.
- Click the
 button at the top right of the screen.
 - Enter a name, date range and output format for your saved report. To automate the report, select Yes next to Automate. Select how often you want to receive the report in the Send area (daily, weekly, monthly,…) and select the recipients (you, or add more email addresses in the text box).

How to use quiz statistics
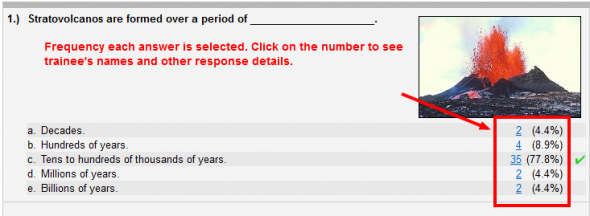
Do you know that you can see which answers learners select on each quiz question? This information is available on the Quiz Statistics report.
You can use this information to improve your quiz, clarifying questions and answers and minimizing confusion amongst learners.
Writing good quiz questions and answers is challenging, but using the insight gained from quiz statistics lets you create better quizzes.

Review course survey responses
Do you have a post-training survey at the end of your course? If so, you can see the survey responses via the Course Information report. When setting up the report be sure to check the survey column in the 'Report Fields' section of the form. After you run the report, click on the survey icon in the Survey column (far right column).
Much like the Quiz Statistics report above, the Survey Results are displayed with the raw number and percentage of trainees that selected each response. You can drill down to get additional details about the response.
Is there another report you'd like to see? Let us know!